Pages

Saturday, February 22, 2014

I/D#1: Unit N: How Do Special Right Triangles and the Unit Circle Relate?

Inquiry Activity Summary


http://gmatprepster.com/wp-content/uploads/2012/07/GMAT-Right-Triangles-1.png
            The objective of the below in-class activity was to derive the values of the Unit Circle from two types of special right triangles (right). For each of the three examples, we labeled the shapes according to the rules of Special Right Triangles, simplified the values of the sides, and identified the three vertices of each as ordered pairs.

Activity page 1 of 2. Click to enlarge.
Activity page 2 of 2. Click to enlarge.


30° Triangle

http://www.montereyinstitute.org
/courses/DevelopmentalMath/COURSE_TEXT2_RESOURCE/U19_L1_T3
_text_final_3_files/image099.gif
      As seen in the first example of the activity, the shape contains three angles (30°, 60°, 90°). Thus, according to the rules of Special Right Triangles, the hypotenuse (r) is valued at 2x; the horizontal value (x) is x; the vertical value (y) is x√3. Due to the fact that we are instructed to simplify so that the "r" is equal to 1, we divide 2x by 2x. Just as in any given equation, what we do to one side, we must do to the other; we divide the values of the other two sides of the triangle by 2x. We are left with "r"= 1, "x"= √3/2, and "y"= 1/2.


45° Triangle

http://www.montereyinstitute.org
/courses/DevelopmentalMath/COURSE_TEXT2_RESOURCE/U19_L1_T3
_text_final_3_files/image036.gif
          As seen in the second example of the activity, the shape contains three angles (45°, 45°, 90°). Therefore, according to the rules of Special Right Triangles, the hypotenuse (r) is valued at x√2; the horizontal value (x) is x; the vertical value (y) is also x. As before, we simplify so that the "r" is equal to 1, meaning we divide x√2 by itself. Afterwards, we divide the values of the other two sides of the triangle by x√2. For the "x" and "y" values, we are left with an unacceptable radical in the denominator. To resolve this, we multiply both the top and the bottom by √2 and simplify.In the end we get "r"= 1, "x"= √2/2, and "y"= √2/2. Using this information, we then find the coordinates of the vertices that can be seen on page 2 of the activity.


60° Triangle 

http://www.montereyinstitute.org
/courses/DevelopmentalMath/COURSE_TEXT2_RESOURCE/U19_L1_T3
_text_final_3_files/image108.gif
Similar to the first example, the third shape has three angles (60°, 30°, 90°). Thus, according to the rules of Special Right Triangles, the hypotenuse (r) is valued at 2x; the horizontal value (x) is x; the vertical value (y) is x√3. We are instructed to simplify so that "r" is equal to 1, so we divide 2x by 2x. Like before, we must divide the other two sides of the triangle by 2x. We are left with "r"= 1, "x"= 1/2, and "y"= √3/2. Using this information, we find the vertices of the shape on a coordinate plane (see page 2 of activity).


http://www.pccmathuyekawa.com/classes-taught/math_7ab/unit%20circle.jpg
          
       
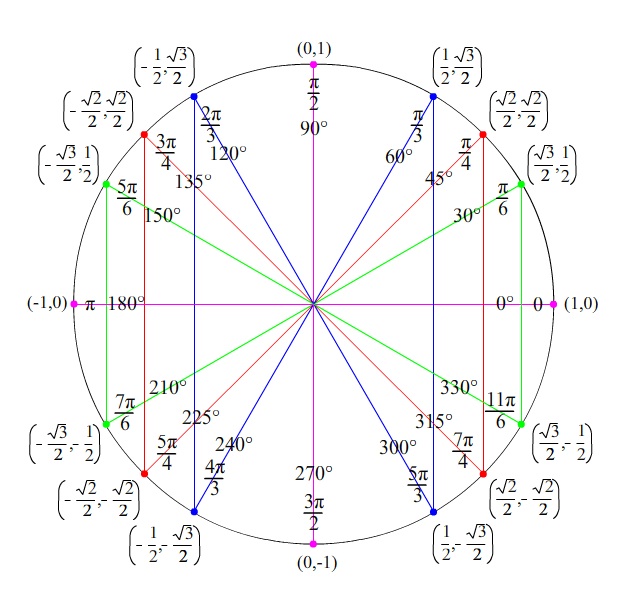
           By labeling and simplifying the values of the special right triangles, I was able to identify the vertices of the shapes. If I were to plot these points within the first quadrant of a coordinate plane, I would obtain one fourth of the Unit Circle! Using this information, I could simply flip the triangles across the axes of the said coordinate plane as depicted (right) to find the rest of the circle.


          The triangles drawn in this activity lie within the first quadrant of a coordinate plane, where both the "x" and the "y" values of the vertex are positive. As shown in the picture to the left, if a triangle was flipped across the x-axis (quadrant IV), the x-value would remain positive, while the y-value would become negative. Conversely, if a triangle was flipped across the y-axis (quadrant II), the x-value would become negative while the y-value would remain positive. If a triangle was flipped both across both axes (quadrant III), then both the "x" and "y" values would become negative.


Inquiry Activity Reflection 


The coolest thing I learned from this activity was that when memorizing the Unit Circle, I only actually have to recall one fourth of it! This activity will help me in this unit because it will help me remember the values and degrees of the unit circle in preparation for the upcoming test. Something I never realized before about special right triangles and the unit circle is that when the shapes are drawn on a coordinate plane, their vertices can be connected to form a circle!


To learn more about angles and the unit circle, visit Crystal Kirch's blog here!

Works Cited 

  • http://gmatprepster.com/wp-content/uploads/2012/07/GMAT-Right-Triangles-1.png 
  • http://www.pccmathuyekawa.com/classes-taught/math_7ab/unit%20circle.jpg
  • http://kirchmathanalysis.blogspot.com/p/unit-n.html
  •  http://www.montereyinstitute.org/courses/DevelopmentalMath/COURSE_TEXT2_RESOURCE/U19_L1_T3_text_final_3_files/image099.gif
  • http://www.montereyinstitute.org/courses/DevelopmentalMath/COURSE_TEXT2_RESOURCE/U19_L1_T3_text_final_3_files/image036.gif 
  • http://www.montereyinstitute.org/courses/DevelopmentalMath/COURSE_TEXT2_RESOURCE/U19_L1_T3_text_final_3_files/image108.gif



Tuesday, February 11, 2014

RWA#1: Unit M Concept 6: Graphing Hyperbolas & Identifying All Parts

1. Definition

"Hyperbola - The set of all points such that the difference in the distance from two   points is a constant." (Crystal  Kirch)      

2. Descriptions                                                                                           

 https://blogger.googleusercontent.com/img/b/R29vZ2xl/AVvXsEj0qtmzjxnQMmKSnAlrxQP1qAjNVV0kPZ_XFMTLWIKxA1PqrclwGhZtpy7P0o_JjIKT6uhywOllyV_gtKLT9T84mOjKEgxM1EHRRrQPxo7YcmwBF-Jh-fmEkCb0ZJOmo6y_4jx5nLIMLzO7/s400/hyperbola.jpg


http://www.mathwarehouse.com/hyperbola/images/compare-hyperbola-graphs.gif
 
  http://www.youtube.com/watch?v=dn1o6lpu_Sk


Key Parts

           The center is written as an ordered pair (x,y), and it marks the midpoint of the entire  graph. It can be identified algebraically by identifying the "h" and "k" values from the equation. Note that "x" is always partnered with "h", and "y" is always partnered with "k". It can be identified graphically as the point directly in between the drawings of the two asymptotes. The transverse axis is written as an equation. It connects the asymptotes and contains the two vertices; it is perpendicular to the conjugate axis. If “x” comes before “y”, then the axis is written as “y= ”. Vice versa, if “y” comes before “x”, then the axis is written as “x=”. The axis usually appears as a solid line connecting the two graphs of the asymptotes. The conjugate axis is written as an equation; it runs in between the asymptotes, contains the two co-vertices, and is perpendicular to the transverse axis. If “x” comes after “y”, then the axis is written as “x= ”. Vice versa, if “y” comes after “x”, then the axis is written as “y=”. The conjugate axis is usually drawn as a dashed line that runs in between but never touches the asymptotes.

           The vertices are written as ordered pairs. They determine the starting point of each asymptote and lie along the transverse axis. The “x” value of the vertices can be found by moving “a” units from the center along the transverse axis. The center and the vertices have a common “y” value”. The vertices can be found at the point when the asymptotes touch the transverse axis. The co-vertices are written as ordered pairs and they lie along the conjugate axis. The co-vertices and the center share the same “x” value. The “y” value of the vertices can be found by moving “b” units from the center along the conjugate axis. The co-vertices can be found at the ends of the conjugate axis that runs between the two asymptotes. The foci are written as ordered pairs and are located in between each of the asymptotes and determine their width. The further the foci are from the asymptote, the thinner the asymptote becomes and the higher the eccentricity (vice versa). The “x” values of the foci can be found by moving “c” units away from the center along the transverse axis. The foci and the center share the same “y” value. The foci are identified as the points within the opening of the vertices that are “c” units away from the center.
  
               The value of "a" is written as a numerical value that represents the distance between one vertex and the center.  In a standard form equation, the squared value of “a” can be found underneath the first fraction. Graphically, the value can be identified by counting the number of units between the center and a vertex. "b" is also written as a numerical value that represents the distance between one co-vertex and the center. In a standard form equation, the squared value of “b” can be found underneath the second fraction. It can be identified graphically by counting the number of units between one co-vertex and the center. The value of "c" is written as a numerical value and it measures the distance between one foci and the center. After obtaining the values of “a” and “b” from the equation, you can identify “c” plugging in the appropriate numbers into: a^2 + b^2 = c^2. Graphically, it can be found by counting the number of units between the center and one foci. 

            Eccentricity is written as a numerical value. It measures how much a conic section isn't circular. It can be found algebraically by dividing the value of "c" by "a". Because the graph depicts a hyperbola, we know that the eccentricity is greater than one. The asymptotes are written as equations; they start at the vertices and extend rightward and leftward away from the center. If “x” comes before “y” in the equation, the asymptote open left and right; vice versa, the asymptotes open up and down. The asymptotes can be identified by finding two points on the line, or by finding the center and the slope using b/a for horizontal graphs, and a/b for vertical graphs. The standard form is the typical way of writing the equation of a hyperbola. You can find it by completing the square and using the information provided to fill in all the needed parts. You can identify it graphically by following the said steps to complete the necessary parts.  Set everything equal to "1" to complete the equation. To learn more about how to graph hyperbolas from standard form, watch the above video here!

3.  Real World Application

http://www.a-levelphysicstutor.com/images/optics/lnss-ccv-ray02.jpg


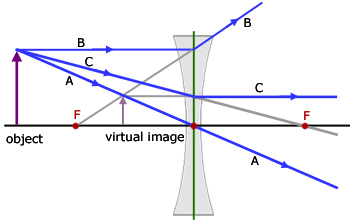
          Hyperbolas, which are found within several variations of math and science, can be applied to everyday life! One of the most common, and possibly the most overlooked example is the use of hyperbolas in glasses and telescopes. Of the two types of lenses that are manufactured, the one that applies the properties of hyperbolas is known as a concave lens. This lens helps people to see objects from greater distances. 

           Similar to our graphs of hyperbolas, the lens has two curves that cave inwards in opposite directions. Likewise, there is a focus point within each of the curves. Concave lenses diffracts, or changes the direction of light waves. As a result, a virtual image of what is actually seen appears on the opposite side of the focal point, nearer the lens. To learn more about concave lenses and their application of hyperbolas, click here.
 

4.  Works Cited 

  • http://www.lessonpaths.com/learn/i/unit-m-conic-section-applets/hyperbola-from-the-definition-geogebra-dynamic-worksheet   
  •  https://blogger.googleusercontent.com/img/b/R29vZ2xl/AVvXsEj0qtmzjxnQMmKSnAlrxQP1qAjNVV0kPZ_XFMTLWIKxA1PqrclwGhZtpy7P0o_JjIKT6uhywOllyV_gtKLT9T84mOjKEgxM1EHRRrQPxo7YcmwBF-Jh-fmEkCb0ZJOmo6y_4jx5nLIMLzO7/s400/hyperbola.jpg 
  •  http://www.mathwarehouse.com/hyperbola/images/compare-hyperbola-graphs.gif
  •  http://www.a-levelphysicstutor.com/images/optics/lnss-ccv-ray02.jpg
  •  http://www.youtube.com/watch?v=dn1o6lpu_Sk
  •  https://www.khanacademy.org/science/physics/waves-and-optics/v/concave-lenses
To learn more about conic sections, visit Crystal Kirch's blog here!