Inquiry Activity Summary
 |
| http://gmatprepster.com/wp-content/uploads/2012/07/GMAT-Right-Triangles-1.png |
The objective of the below in-class activity was to derive the values of the Unit Circle from two types of special right triangles (right). For each of the three examples, we labeled the shapes according to the rules of Special Right Triangles, simplified the values of the sides, and identified the three vertices of each as ordered pairs.
 |
| Activity page 1 of 2. Click to enlarge. |
 |
| Activity page 2 of 2. Click to enlarge. |
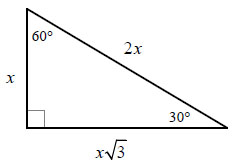
30° Triangle
 |
http://www.montereyinstitute.org
/courses/DevelopmentalMath/COURSE_TEXT2_RESOURCE/U19_L1_T3
_text_final_3_files/image099.gif |
As seen in the first example of the activity, the shape contains three angles (30°, 60°, 90°). Thus, according to the rules of Special Right Triangles, the hypotenuse (r) is valued at 2x; the horizontal value (x) is x; the vertical value (y) is x√3. Due to the fact that we are instructed to simplify so that the "r" is equal to 1, we divide 2x by 2x. Just as in any given equation, what we do to one side, we must do to the other; we divide the values of the other two sides of the triangle by 2x. We are left with "r"= 1, "x"= √3/2, and "y"= 1/2.
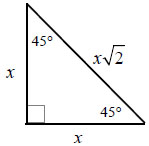
45° Triangle
 |
http://www.montereyinstitute.org
/courses/DevelopmentalMath/COURSE_TEXT2_RESOURCE/U19_L1_T3
_text_final_3_files/image036.gif |
As
seen in the second example of the activity, the shape contains three
angles (45°, 45°, 90°). Therefore, according to the rules of Special Right
Triangles, the hypotenuse (r) is valued at x√2; the horizontal value (x)
is x; the vertical value (y) is also x. As before, we simplify so that the "r" is equal to 1, meaning we divide x√2 by itself. Afterwards, we divide the values of the other two sides of the triangle
by x√2. For the "x" and "y" values, we are left with an unacceptable radical in the denominator. To resolve this, we multiply both the top and the bottom by √2 and simplify.In the end we get "r"= 1, "x"= √2/2, and "y"= √2/2. Using this information, we then find the coordinates of the vertices that can be seen on page 2 of the activity.
60° Triangle
 |
http://www.montereyinstitute.org
/courses/DevelopmentalMath/COURSE_TEXT2_RESOURCE/U19_L1_T3
_text_final_3_files/image108.gif |
Similar to the first example, the third shape has three angles (60°, 30°, 90°). Thus, according to the rules of Special Right Triangles, the hypotenuse (r) is valued at 2x; the horizontal value (x) is x; the vertical value (y) is x√3. We are instructed to simplify so that "r" is equal to 1, so we divide 2x by 2x. Like before, we must divide the other two sides of the triangle by 2x. We are left with "r"= 1, "x"= 1/2, and "y"= √3/2. Using this information, we find the vertices of the shape on a coordinate plane (see page 2 of activity).
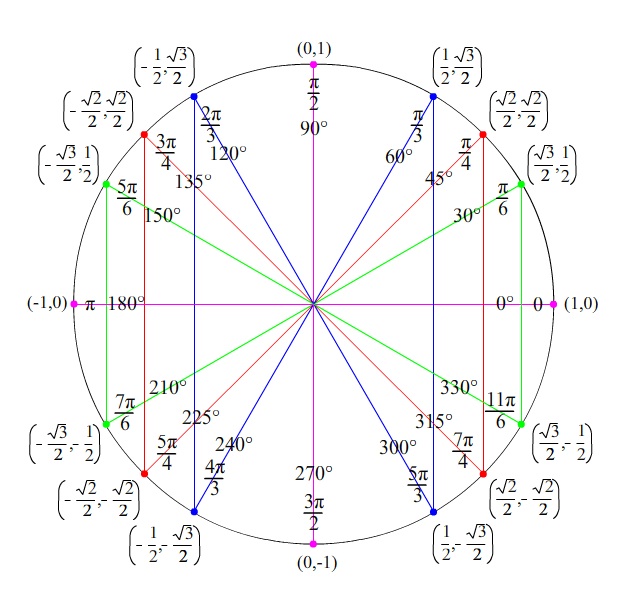 |
| http://www.pccmathuyekawa.com/classes-taught/math_7ab/unit%20circle.jpg |
By labeling and simplifying the values of the special right triangles, I was able to identify the vertices of the shapes. If I were to plot these points within the first quadrant of a coordinate plane, I would obtain one fourth of the Unit Circle! Using this information, I could simply flip the triangles across the axes of the said coordinate plane as depicted (right) to find the rest of the circle.
The triangles drawn in this activity lie within the first quadrant of a coordinate plane, where both the "x" and the "y" values of the vertex are positive. As shown in the picture to the left, if a triangle was flipped across the x-axis (quadrant IV), the x-value would remain positive, while the y-value would become negative. Conversely, if a triangle was flipped across the y-axis (quadrant II), the x-value would become negative while the y-value would remain positive. If a triangle was flipped both across both axes (quadrant III), then both the "x" and "y" values would become negative.
Inquiry Activity Reflection
The coolest thing I learned from this activity was that when memorizing the Unit Circle, I only actually have to recall one fourth of it! This activity will help me in this unit because it will help me remember the values and degrees of the unit circle in preparation for the upcoming test. Something I never realized before about special right triangles and the unit circle is that when the shapes are drawn on a coordinate plane, their vertices can be connected to form a circle!
To learn more about angles and the unit circle, visit Crystal Kirch's blog here!
Works Cited
- http://gmatprepster.com/wp-content/uploads/2012/07/GMAT-Right-Triangles-1.png
- http://www.pccmathuyekawa.com/classes-taught/math_7ab/unit%20circle.jpg
- http://kirchmathanalysis.blogspot.com/p/unit-n.html
- http://www.montereyinstitute.org/courses/DevelopmentalMath/COURSE_TEXT2_RESOURCE/U19_L1_T3_text_final_3_files/image099.gif
- http://www.montereyinstitute.org/courses/DevelopmentalMath/COURSE_TEXT2_RESOURCE/U19_L1_T3_text_final_3_files/image036.gif
- http://www.montereyinstitute.org/courses/DevelopmentalMath/COURSE_TEXT2_RESOURCE/U19_L1_T3_text_final_3_files/image108.gif